The Data Explorer
Main View for Analyzing and Managing Data
The Data Explorer is the primary interface for high-volume data inspection, refinement, and mutation. It is designed for desktop usage and optimized for wide tables, dense result sets, and multi-dimensional filtering.
The Data Explorer operates in two phases:
- Dataset construction – selecting a source table, related data, and classifications
- Client-side interaction – sorting, grouping, filtering, and editing executed entirely in the browser
Once a dataset is loaded, all transformations are applied locally, avoiding additional server roundtrips and enabling high-performance exploratory workflows.
The view is accessed from the main menu under Data Explorer.
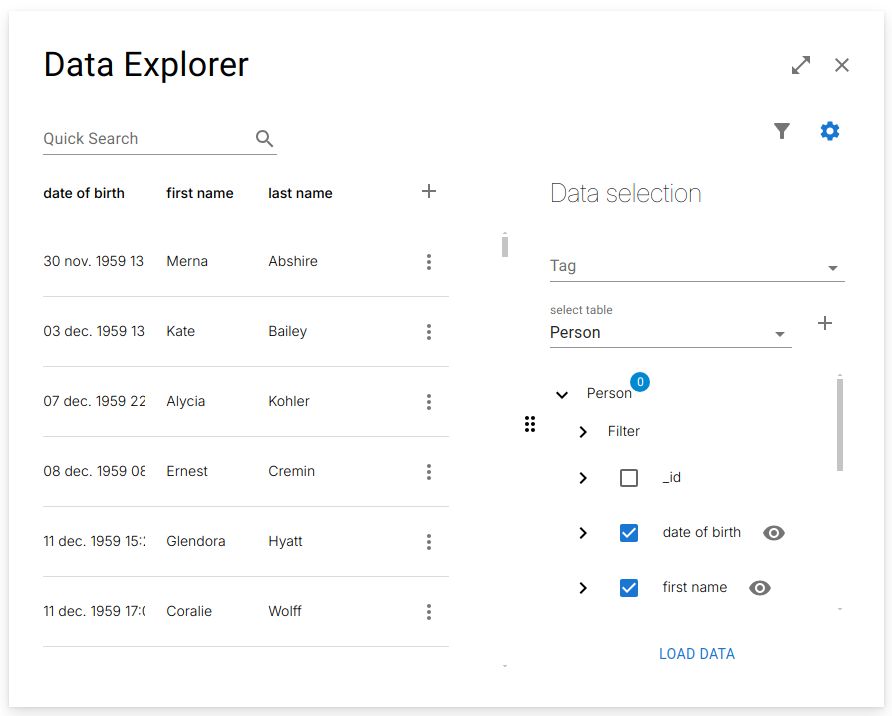
Selecting first name, last name, and date of birth from Person.
Selecting the Data
All datasets start from a source table, which defines:
- The primary row identity
- The root for all relation traversal
- The default row scope for the dataset
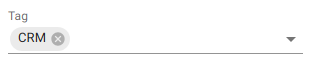
In large schemas, the table list can be filtered by tags to limit the search domain (e.g. "CRM", "Finance", "Operations").
Once a source table is selected:
- All non-system columns
- The ID column
are automatically included in the dataset.

This provides a minimal, immediately usable working set without requiring manual column selection.
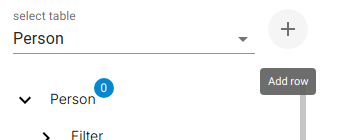
Adding New Rows
Each table node exposes a create action. Activating it opens a smart form bound to the source table schema.
The form is schema-driven and enforces:
- Required fields
- Data types
- Write rules
- Relation constraints
Filtering Rows
Each table node exposes a row filter control. This applies row-level predicates directly to the dataset.

These filters are independent of column filters and operate at the row selection phase.
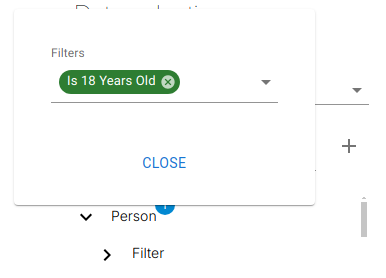
Adding Filters (Classifications)
Below the source table, a Filters node exposes all classifications marked as usable filters.
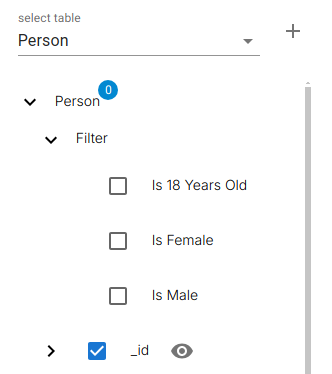
When added, classifications behave as virtual columns and participate in filtering and grouping.
Exploring Relationships
All outbound relations from the source table appear as relation nodes (e.g. Address, Gender). These allow:
- Inclusion of related table columns
- Recursive traversal of deeper relations
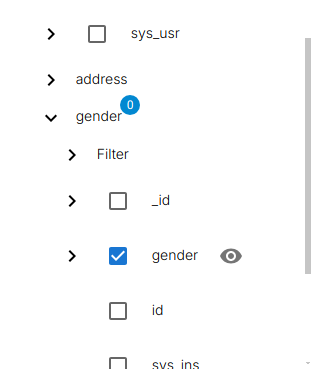
Each added relation expands the dataset along the relational graph without changing the row identity of the source table.
Managing Column Visibility
Each selected column exposes a visibility toggle. Hidden columns:
- Remain usable for filtering
- Are excluded from the table rendering


This allows clean analytical layouts where helper columns participate in logic but not in presentation.
Working with Columns in the Table
The Data Explorer table supports structural manipulation of result sets through per-column controls.
Column Options

- Sort

Ascending / descending ordering of the active row set.
- Resize

Horizontal resizing of the column width.
- Reorder

Drag-based repositioning of column order.
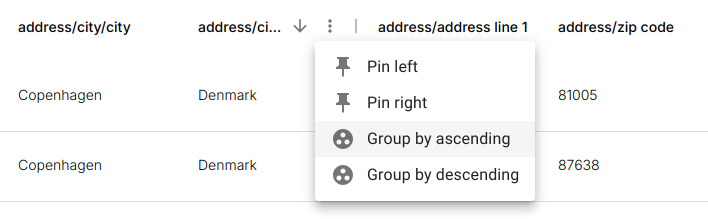
Column Settings Menu

-
Pin Left / Pin Right Fixes the column during horizontal scrolling.
-
Group Ascending / Descending Moves the column into the grouping layer and applies hierarchical aggregation.
Pinned columns remain fixed until explicitly unpinned.
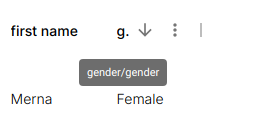
Column Naming in the Table
To preserve origin clarity, column names follow strict naming rules:
- Source table columns Use their native column name
- Relation-derived columns Use path notation
Example:
- Classifications Appear as computed boolean fields

Viewing Full Column Names
When truncated due to width, hovering the header shows the full structural path.
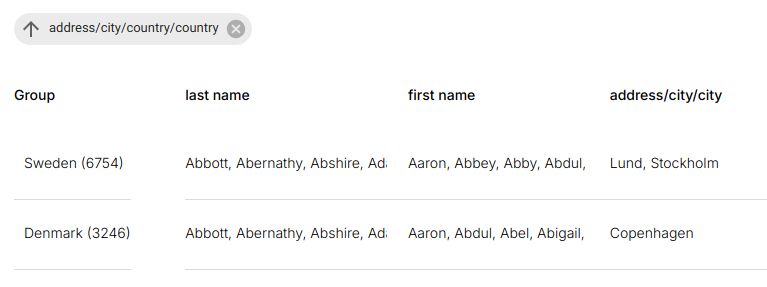
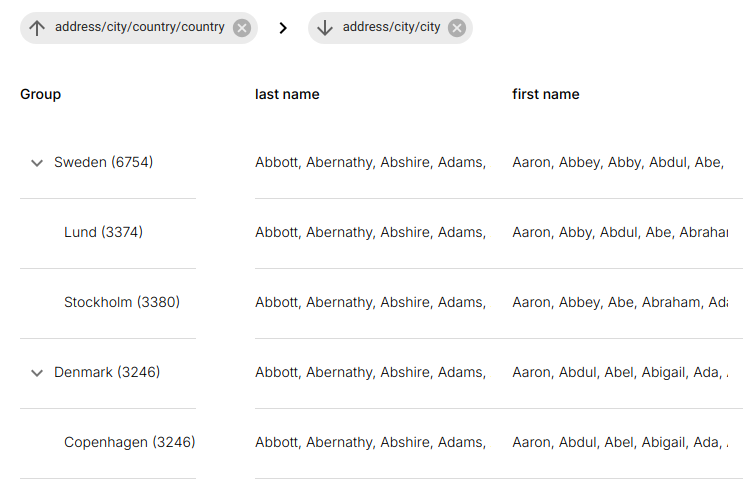
Grouping Data
Grouping introduces hierarchical aggregation layers on top of the current dataset.
Activating Grouping
Grouping is applied per column via the column menu.
Grouping Representation
- Active groupings appear as tags above the table
- A grouping column is inserted at the leftmost position
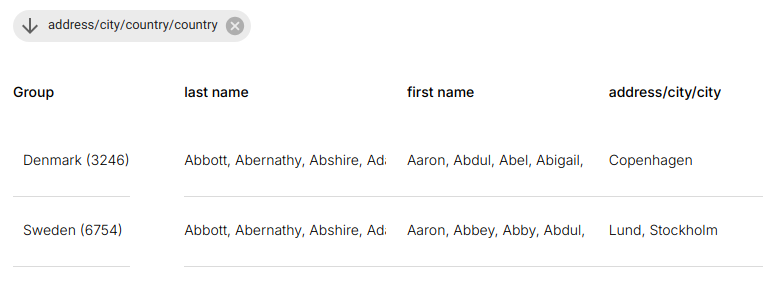
Aggregation Rules
For each group:
- Numeric fields → summed
- String fields → concatenated (truncated)
- Other types → row count
Managing Groupings
-
Change sort order
-
Multiple grouping levels
-
Remove grouping Removes the tag and restores flat row layout.
Filtering Data
Filtering is fully client-executed and operates independently per column.
Activating Filters
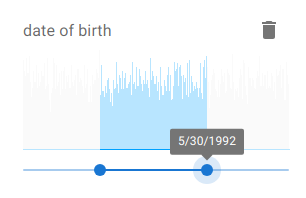
![]()
Filter Types
- Date Columns → histogram-based range selection
- High-cardinality Fields → text search

- Low-cardinality Fields → searchable multi-select dropdown

Quick Search
A global text search runs across all visible columns simultaneously.

Filtering Execution Model
All filters execute entirely in memory on the active dataset:
- No network latency
- No server recomputation
- Instant feedback during exploration
Working with Data in the Table
Each row represents one physical record in the source table. A per-row operation menu is exposed.

Row Operations
- Edit – Opens schema-bound update form
- Delete – Executes row-level delete with confirmation
- Open in Navigator – Opens record in the Data Navigator
- View Change Log – Opens full audit history
Editing Related Data Inline
Cells originating from related tables are editable directly:
- Double-click opens the smart form bound to the target table
- The relation itself remains unchanged unless explicitly modified
This enables direct mutation of dependent entities (e.g. Address, Gender) without leaving the current analytical context.